Deutsche Agrarforschungsallianz (DAFA)
Bundesallee 50
German Agricultural Research Alliance
38116 Braunschweig
GERMANY
Phone: +49-531-596 1017
Fax: +49-531-596 1099
E-mail:
code] [CV]

|
|
Other Web Sites |
My interests have moved to project and knowledge management. Jointly with my colleague I am managing the alliance of publicly funded agricultural research institutes and coordinating the development of joint research goals and strategies.
The last research project I worked with was MACSUR. The project MACSUR deals with the effects of climate change on food security in Europe. I have managed the project/network (knowledge hub) from 2012 to 2017. The knowledge hub links crop modellers with livestock and farm modellers and scoio-economic modellers. The issue of food security under climate change stretches across disciplines, scales of time and space and requires practical implementations. I am interested in strategies for scaling up results from farm level to European level, the propagation of variability along the scaling process, and the moderating effect of markets on yield variability. I was the executive coordinator of the project, responsible for the day-to-day management of MACSUR.

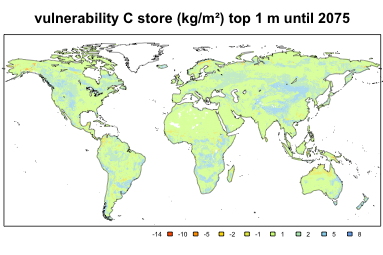
For improving the understanding of how forests, meadows, bogs and other ecosystems contribute or buffer the emission of green house gases, researchers need to know the turnover of these gases and the storage of their compounds in biomass. Results and data coming from research in these fields is accumulating but not in an organized way. A long time is often needed to find specific data necessary for simulating future climate. To increase the availability of the data I was reviewing exisiting data sets as part of the EU project COCOS. I also assessed the global vulnerability of soil organic carbon stocks using a Baysian Network.

| How is the geographic range of long-lived species tied to changes in climate? Can the frequency of extreme events in heat or frost in combination with extreme dispersal events explain range shifts? A simple model shows that the frequency distribution of extreme events and its movement with climate change has great significance for the front and rear of a range. |  |
|
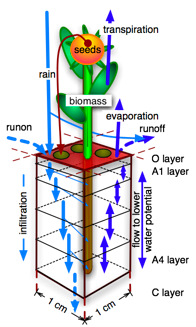
Climate change in dry Mediterranean regions like the Middle East is a potential threat for many people in that densely populated area. Global Circulation Models project higher temperatures and more frequent rain storms but fewer light rains. It is unclear whether this results in more or less rain in total. Using spatially explicit models I have examined what the change in rain distribution means for the natural vegetation and its capacity to provide food for sheep and goats. This work is part of the GLOWA Jordan River project. Some of the results are presented as probability or Bayesian nets. I programmed a computer model of populations of annual plants simulating the daily rainfall, water dynamics of the soil, plant germination, plant growth of individual plants, resource allocation, and seed bank dynamics in a grid composed of 1 cm2-cells. Simulations using realistic rainfall distributions showed that changes in daily rainfall as projected by climate change scenarios have the same order of magnitude as projected changes in annual volumes. The results of the annuals model were combined with results of a colleague's shrub model to parameterize a landscape model of vegetation dynamics in a prototypic wadi landscape to assess the effect of topography and climate change on vegetation dynamics and runoff under various grazing regimes. The simulations showed that grazing pressure was more important than climate change for vegetation dynamics. However, climate change and grazing intensity interacted to increase the risk of erosion in semi-arid regions. |  |
Nitrogen is a growth-limiting resource in most temperate and boreal ecosystems. Human activity, especially burning of fossil fuels, releases nitrogen compounds into the air. When the compounds are washed out by rain or simply settle onto plant leaves or soil they act as fertilizers. Using ion exchange resin (IER), I measured deposition of nitrogen from the atmosphere to in six national parks in the prairie provinces. Four parks were in densely populated regions, the others (Jasper, Wood Buffalo) in remote areas. At the same time I measured nitrogen availability in the soil with IER, nitrogen and carbon storage in several vegetation compartments, and nitrogen and carbon isotope ratios in the vegetation. Nitrogen deposition was higher downwind from central Alberta, the isotope ratios indicated that combustion processes were the main source. Historic forest invasion rates, measured from air photographs, were correlated to historic population density and current N deposition rates. |  |
|
Competition along with its counterpart, facilitation, are though to structure undisturbed ecosystems. If a resource like nitrogen is scarce, plants compete for capturing the nitrogen. More successful plants can grow bigger and replace less competitive plants. I studied the relative competitive ability of woody and herbaceous vegetation in neighbour removal experiments, combined with resource measurements or resource manipulations. Woody vegetation had stronger effects on available nitrogen than herbaceous vegetation, but the effects of both growth forms were similar on light and soil moisture. Accounting for the higher biomass of woody vegetation its effects were always weaker than those of herbaceous vegetation. |
|
|
To identify processes facilitating the invasion of aspen into prairie, I have conducted litter decomposition experiments with reciprocal litter exchange between habitats and additional shading. In a novel approach I used ion-exchange resin (IER) to measure the nitrogen input and output during the initial stages of decomposition. Litter decomposed faster in sun-exposed treatments, indicating a strong effect of photodegradation. The experiment also showed that atmospheric deposition of N in the prairie was higher than previously thought. | |
|
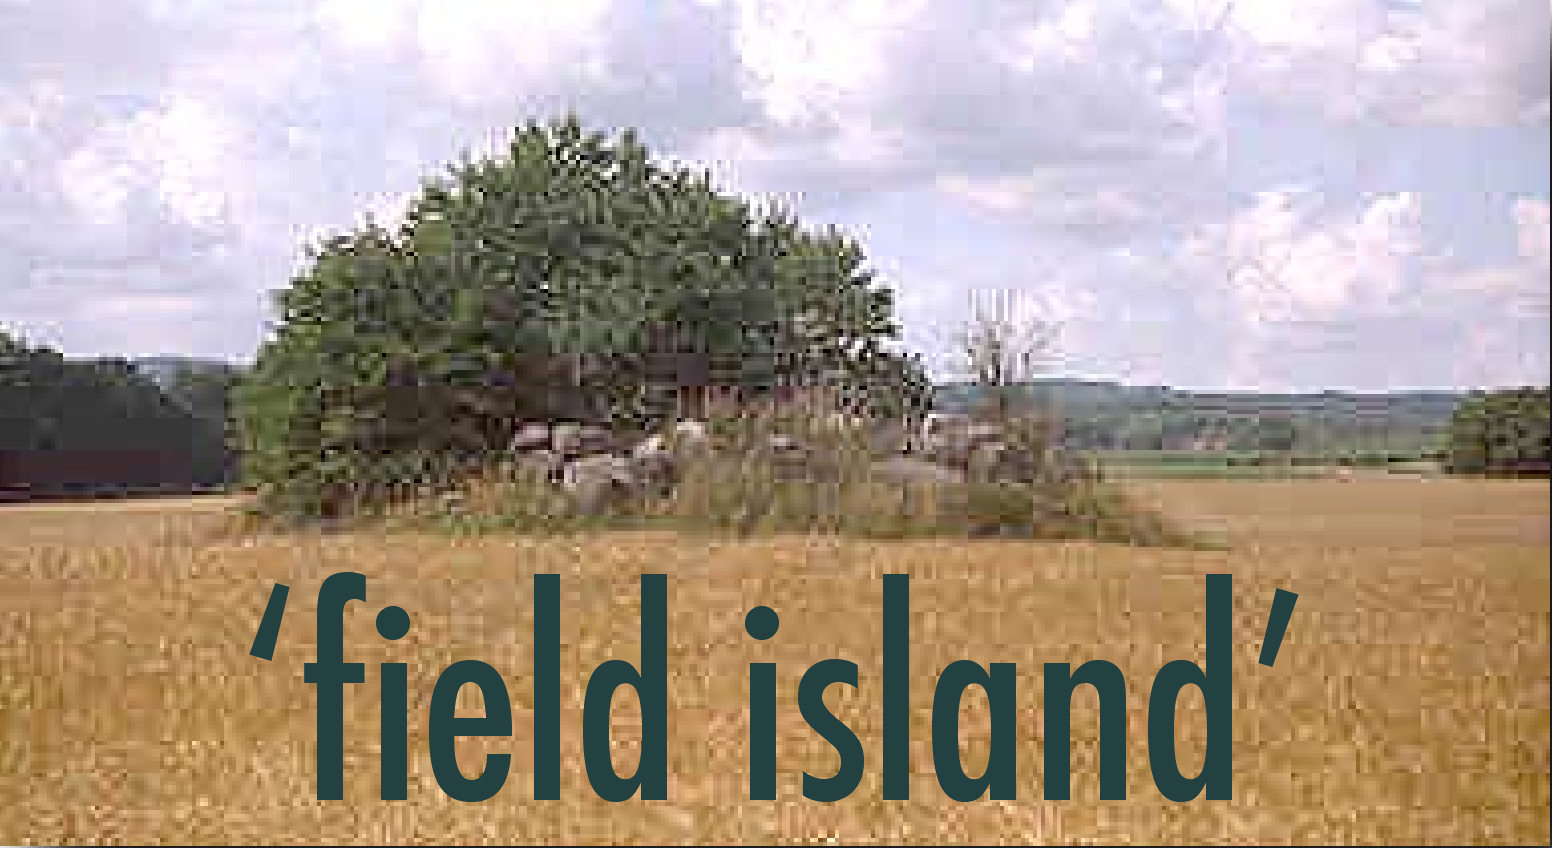
I have used hierarchical sets of vegetation surveys on habitat islands in an agricultural matrix to test predictions of the theory of island biogeography in Sweden. The results showed that the processes predicted by the theory did not contribute significantly to the species-area curve. |  |
|
Monitoring of engineered nano-particles in the environment |  TEM (a, b, and c) images of prepared mesoporous silica nanoparticles with mean outer diameter: (a) 20nm, (b) 45nm; and (c) 80nm. SEM (d) image corresponding to (b). The insets are a high magnification of mesoporous silica particle. [Image by Nandiyanto, public domain] |
Page last updated 2017-02-01. ![[MacOS]](../Made_w_MacOS.gif)